135 major reservoirs, updated daily from official Bureau of Reclamation, California DWR, and Texas Water Development Board gauges.
Western Reservoir Conditions·Daily·No. 91··Latest reading
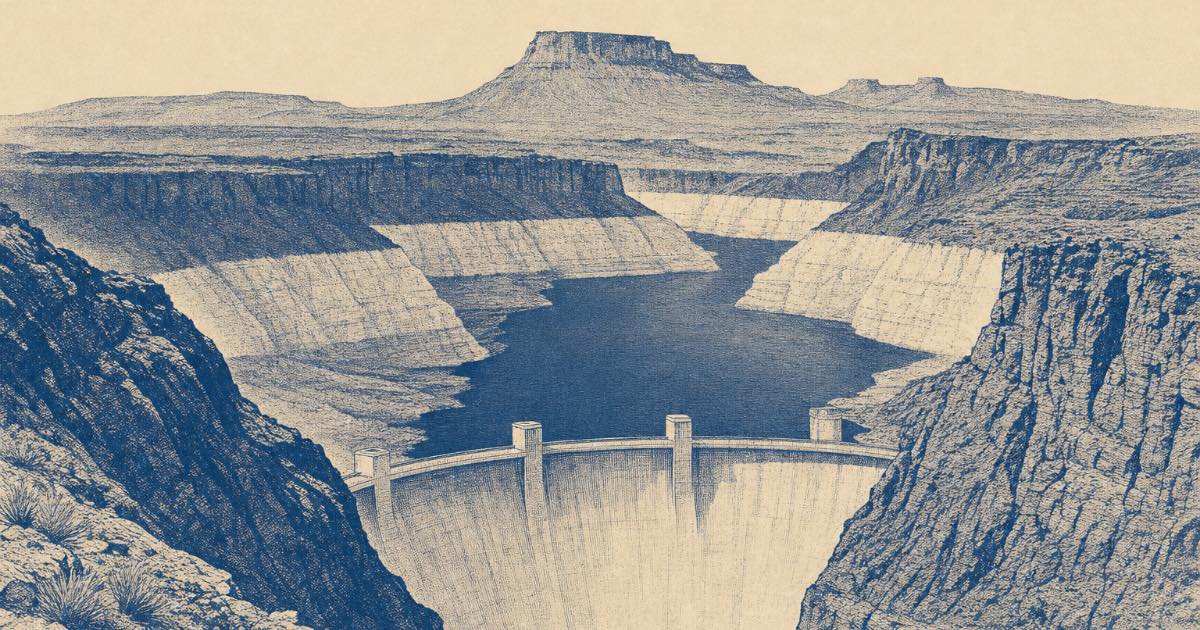
Western reservoirs at low water - daily elevation, storage and percent full for 135 of them, straight from the government gauges that measure them. Illustration; not a photograph and not a specific reservoir.
Of the 135 reservoirs tracked here, 30 are below half of capacity right now, and 103 hold less water than they did a year ago (31 hold more). The Colorado River system as a whole is 30.6% full - low. The emptiest reservoir on this page is Palo Duro Reservoir at 0.4%; the fullest is Comanche Creek Reservoir at 100.0%.
Colorado River system30.6% fullLow17.79 of 58.15 MAF across 7 reservoirs−3.78 MAF vs 1 yr agoas of · system page →
❄️ Snowpack watch: Upper Colorado Basin snowpack peaked near 72% of normal in water year 2026 (below normal), the snow that feeds Powell and Mead. See the snowpack tracker →
Lake Mead is 26.0% full at 1,037.19 feet - very low on this site's capacity scale - and Lake Powell is 23.0% full at 3,521.76 feet (very low) as of .
The seven Colorado River system reservoirs tracked here hold 17.79 million acre-feet combined - 30.6% of their combined 58.15 million acre-foot capacity.
Shasta Lake is 51.2% full, Lake Oroville is 43.8% full, and Folsom Lake is 39.7% full as of - see all eight tracked California reservoirs.
Every number on this site comes from an official government gauge (Bureau of Reclamation, California DWR, or the Texas Water Development Board), is stamped with its as-of date, and is downloadable as a full-history CSV.
Showing all 135 reservoirs
Effectively full 95% and aboveHigh 75–95%Moderate 50–75%Low 30–50%Very low 15–30%Critically low under 15%
These bands describe share of capacity, not drought severity - some reservoirs are held near the top of a narrow band by design. How they are defined.
Seven reservoirs on the Colorado and its tributaries. Mead and Powell hold nearly all of the system's water; the rest are regulating or headwater units held closer to full.
Eight of California's largest reservoirs, from Trinity and Shasta in the north to San Luis in the Central Valley. These refill from winter rain and Sierra snowmelt, so they normally peak in spring and draw down through the summer.
Six reservoirs across central Texas and the Rio Grande. The Highland Lakes above Austin and Canyon Lake respond quickly to storms; Amistad, Falcon and Elephant Butte track the longer Rio Grande drought.
Colorado River system storage - combined storage across all seven tracked reservoirs, with a downloadable daily system-total CSV. Colorado River shortage tiers - the 1,075 / 1,050 / 1,025 ft Lake Mead thresholds from the 2007 Interim Guidelines and DCP, and what applies in 2026. Post-2026 operating guidelines - the process replacing the current rules, which expire at the end of 2026. Data downloads - full-history daily CSVs for all 135 reservoirs.
Changes shown are elevation changes in feet over the trailing week and year. Percent full is storage divided by each reservoir's published capacity - bases and sources on the about page. This site publishes observations only: no forecasts of its own, no advice.
Get the reservoir data in your inbox
For reporters and researchers: an occasional heads-up when Western
reservoirs hit a notable milestone - a new record low, a shortage-tier change,
or the yearly Colorado River operating decision - with the government data
behind it. No spam.
Free · double opt-in · unsubscribe anytime · we store only your email.