Lake Travis Water Level Today - 677.39 ft, 93.9% Full
Mansfield Dam · Colorado River (Texas) · Texas - updated daily from official gauges
Western Reservoir Conditions·Daily·No. 92··Latest reading
- Lake Travis is 93.9% full - high on this site's capacity scale - as of . Surface elevation 677.39 feet, storage 1,030,807 acre-feet (capacity basis 1,098,044 acre-feet), per Texas Water Development Board data.
- That elevation is 63.21 feet above its record low of 614.18 ft (, the lowest since the reservoir first filled), in a daily record going back to September 30, 1940 (TWDB's period of record for this reservoir).
- Storage is 122% of the October 23 average across 85 years of record.
- Lake Travis is falling: elevation changed -0.35 ft over the past week, +2.08 ft over the past month, and +7.78 ft over the past year, per Texas Water Development Board data.
Lake Travis is holding near the top of its operating range at 93.9% of capacity, +7.78 ft over the past twelve months.
Lake Travis operating range
Lake Travis is operated within a narrow band rather than drawn down and refilled over years. As of it sits 3.61 feet below its 681.0 ft full-pool reference. Over the past two years the daily record ranges from 635.30 ft () to 684.71 ft () - a band of 49.41 feet. The highest reading in the full record is 710.31 ft on .
Storage above the full-pool reference is flood control space, not supply. A reservoir reading at or near 100% of its conservation capacity is being operated normally - it is not a surplus, and the operator may release water to hold that space.
Lake Travis storage in context
| Reading | Elevation (ft) | Storage (AF) | % full |
|---|---|---|---|
| Today (October 23, 2026) | 677.39 | 1,030,807 | 93.9% |
| One year ago | 669.61 | 896,386 | 81.6% |
| Five years ago | 663.09 | 794,789 | 72.4% |
| Record low (August 14, 1951) | 614.18 | 288,562 | 26.3% |
| Capacity basis | 681.00 | 1,098,044 | 100.0% |
Lake Travis water level, past 12 months
93.9% full at the latest reading - across the past 12 months it ranged from 72.6% (April 19, 2026) to 100.0% (August 2, 2026). Percent full is storage against the 1,098,044-acre-foot capacity basis, not a share of the elevation plotted above.
Lake Travis elevation, full record
93.9% full at the latest reading - across the storage record since September 30, 1940 it ranged from 1.7% (October 31, 1940) to 101.4% (July 5, 2019). Percent full is storage against the 1,098,044-acre-foot capacity basis, not a share of the elevation plotted above. Every percentage here is measured against today's capacity basis; a reservoir's surveyed capacity changes as sediment accumulates behind the dam, so early-record percentages are indicative rather than exact.
Last 14 daily readings
| Date | Elevation (ft) | Day change | Storage (AF) |
|---|---|---|---|
| October 23, 2026 | 677.39 | -0.06 ft | 1,030,807 |
| October 22, 2026 | 677.45 | -0.06 ft | 1,031,901 |
| October 21, 2026 | 677.51 | -0.08 ft | 1,032,995 |
| October 20, 2026 | 677.59 | +0.01 ft | 1,034,455 |
| October 19, 2026 | 677.58 | -0.04 ft | 1,034,273 |
| October 18, 2026 | 677.62 | -0.05 ft | 1,035,003 |
| October 17, 2026 | 677.67 | -0.07 ft | 1,035,917 |
| October 16, 2026 | 677.74 | -0.04 ft | 1,037,197 |
| October 15, 2026 | 677.78 | -0.03 ft | 1,037,929 |
| October 14, 2026 | 677.81 | -0.04 ft | 1,038,478 |
| October 13, 2026 | 677.85 | -0.02 ft | 1,039,211 |
| October 12, 2026 | 677.87 | -0.06 ft | 1,039,577 |
| October 11, 2026 | 677.93 | -0.05 ft | 1,040,677 |
| October 10, 2026 | 677.98 | - | 1,041,594 |
Frequently asked questions
What is the water level of Lake Travis today?
As of October 23, 2026, Lake Travis's surface elevation is 677.39 feet, with 1,030,807 acre-feet in storage - 93.9% of the 1,098,044 acre-foot capacity basis. Source: Water Data for Texas (TWDB) daily data.
How full is Lake Travis?
Lake Travis is 93.9% full as of October 23, 2026. Its storage is 122% of the October 23 average across its record since 1940. Source: Water Data for Texas (TWDB) daily data.
When was Lake Travis last full?
Lake Travis was last at or above 95% of its 1,098,044 acre-foot capacity basis on September 3, 2026. As of October 23, 2026 it is 93.9% full. Source: Water Data for Texas (TWDB) daily data.
Is Lake Travis rising or falling?
Lake Travis is falling: its elevation changed -0.35 feet over the week ending October 23, 2026, +2.08 ft over the past month, and +7.78 feet over the past year. Source: Water Data for Texas (TWDB) daily data.
What was Lake Travis's lowest water level on record?
Lake Travis's lowest surface elevation since it first filled (its first near-full reading in this series is from 1942) was 614.18 feet on August 14, 1951, per the daily record used by this site. As of October 23, 2026 the reservoir is 63.21 feet above that record low.
About this gauge
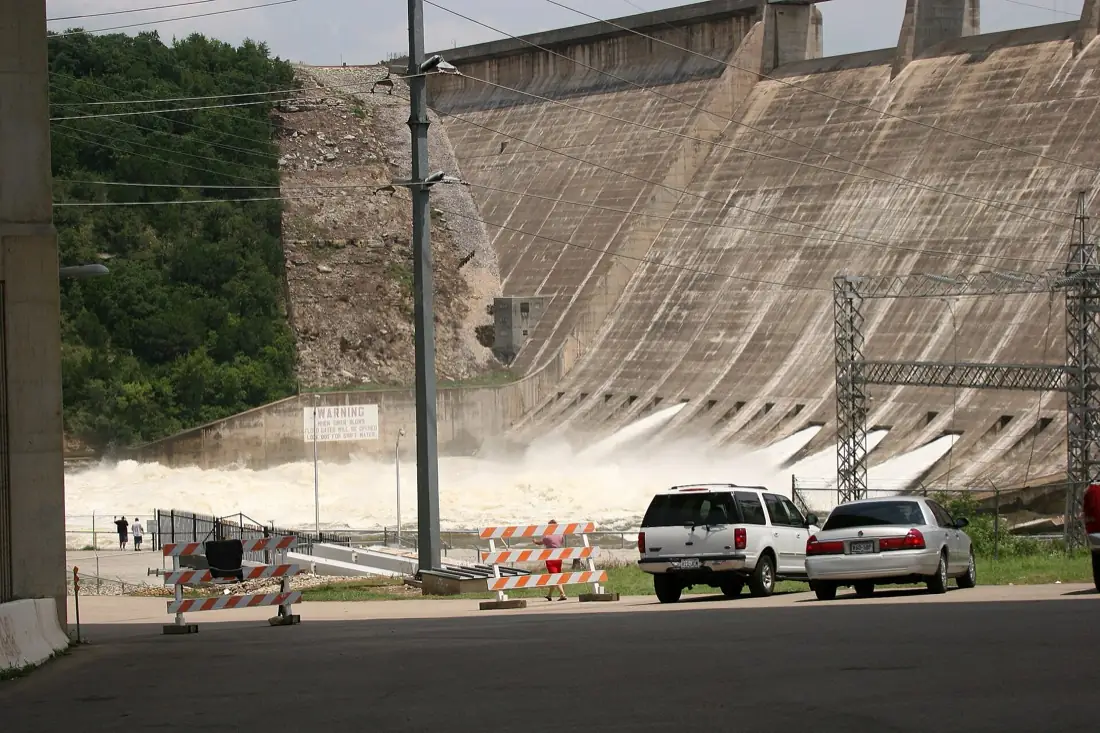
Lake Travis, behind Mansfield Dam northwest of Austin, is the largest of the Highland Lakes operated by the Lower Colorado River Authority on the Texas Colorado River, and the region's main flood-control and water-supply reservoir.
- Operator
- Texas Water Development Board (Water Data for Texas)
- Station
- travis
- Measurements
- Daily water level and conservation storage
- Dam
- Mansfield Dam
- River
- Colorado River (Texas)
- State
- Texas
- Coordinates
- 30.3910, -97.9066 (USGS NWIS site 08154500 (NAD83))
- Full pool reference
- 681.0 ft
- Capacity basis
- 1,098,044 acre-feet (Water Data for Texas (TWDB) conservation capacity)
- Period of record
- September 30, 1940 (TWDB's period of record for this reservoir)
- Status
- Provisional - subject to revision by the reporting agency
- Update cadence
- Daily
TWDB reports conservation storage against a conservation capacity that is restated as new volumetric surveys are completed, so a percent-full figure here can change without the water level changing. TWDB's methodology page is linked in the notes below.
Download the daily CSV (date, elevation ft, storage AF) or see all data downloads.
Other reservoirs tracked
Texas & Rio Grande: Lake Buchanan, Canyon Lake, Amistad Reservoir, Falcon Lake, Elephant Butte Reservoir, Lake Abilene, Lake Alan Henry, Lake Amon G Carter, Aquilla Lake, Lake Arlington, Lake Arrowhead, Lake Athens, Lake Austin, B. A. Steinhagen Lake, Bardwell Lake, Belton Lake, Benbrook Lake, Lake Bob Sandlin, Bois d'Arc Lake, Lake Bonham, Brady Creek Reservoir, Bridgeport Reservoir, Lake Brownwood, Caddo Lake, Cedar Creek Reservoir, Champion Creek Reservoir, Lake Cherokee, Choke Canyon Reservoir, Lake Cisco, Lake Coleman, Coleto Creek Reservoir, Lake Colorado City, Comanche Creek Reservoir, Lake Conroe, Lake Corpus Christi, Lake Crook, Lake Cypress Springs, E. V. Spence Reservoir, Eagle Mountain Reservoir, Lake Fork Reservoir, Fort Phantom Hill Reservoir, Lake Georgetown, Gibbons Creek Reservoir, Lake Graham, Lake Granbury, Granger Lake, Grapevine Lake, Greenbelt Lake, Halbert Lake, Hords Creek Lake, Lake Houston, Houston County Lake, Hubbard Creek Reservoir, Moss Lake, Inks Lake, Lake J.B. Thomas, Lake Jacksonville, Cooper (Chapman) Lake, Joe Pool Lake, Lake Kemp, Lake Kickapoo, Lake O the Pines, Lavon Lake, Leon Reservoir, Lewisville Lake, Lake Limestone, Livingston Reservoir, Lost Creek Reservoir, Lake L. B. Johnson, Mackenzie Reservoir, Lake Marble Falls, Martin Lake, Medina Lake, Lake Meredith, Millers Creek Reservoir, Lake Mineral Wells, Monticello Reservoir, Mountain Creek Lake, Murvaul Lake, Lake Nacogdoches, Lake Nasworthy, Navarro Mills Lake, New Terrell City Lake, Lake Nocona (Farmer's Creek), North Fork Buffalo Creek Reservoir, O. C. Fisher Lake, O. H. Ivie Reservoir, Oak Creek Reservoir, Lake Palestine, Palo Duro Reservoir, Lake Palo Pinto, Lake Pat Cleburne, Pat Mayse Lake, Possum Kingdom Lake, Proctor Lake, Lake Ray Hubbard, Ray Roberts Lake, Red Bluff Reservoir, Richland-Chambers Reservoir, Sam Rayburn Reservoir, Somerville Lake, Lake Stamford, Stillhouse Hollow Lake, Lake Striker, Lake Sulphur Springs, Lake Sweetwater, Lake Tawakoni, Lake Texana, Lake Texoma, Toledo Bend Reservoir, Twin Buttes Reservoir, Lake Tyler, Waco Lake, Lake Waxahachie, Lake Weatherford, White River Reservoir, Whitney Lake, Lake Worth, Wright Patman Lake.
Also: Lake Mead, Lake Powell, Lake Mohave, Lake Havasu, Flaming Gorge Reservoir, Blue Mesa Reservoir, Navajo Reservoir, Shasta Lake, Lake Oroville, Folsom Lake, Lake Berryessa, New Melones Lake, Trinity Lake, Don Pedro Reservoir, San Luis Reservoir.
Notes
- 1/Percent full is storage divided by the 1,098,044 acre-foot capacity basis published in the Water Data for Texas (TWDB) conservation capacity. ↩
- 2/Water level and conservation storage are from the Texas Water Development Board's daily record for Lake Travis. TWDB recomputes conservation capacity as survey data are updated, so percent-full may be restated. ↩
- 3/Gauge coordinates 30.3910, -97.9066 - USGS NWIS site 08154500 (NAD83). Elevations are as published by the operating agency; consult the source for the vertical datum in use. ↩
- 4/Period of record for the daily series used here begins September 30, 1940 (TWDB's period of record for this reservoir). Record low is measured over that window only. ↩
- 5/All readings carry the date the gauge reported them, which may lag today's date. This site publishes observations, not forecasts. ↩