reservoirbench

Western US & Texas Reservoir Levels

135 major reservoirs, updated daily from official Bureau of Reclamation, California DWR, and Texas Water Development Board gauges.

Western Reservoir Conditions·Daily·No. 99··Latest reading

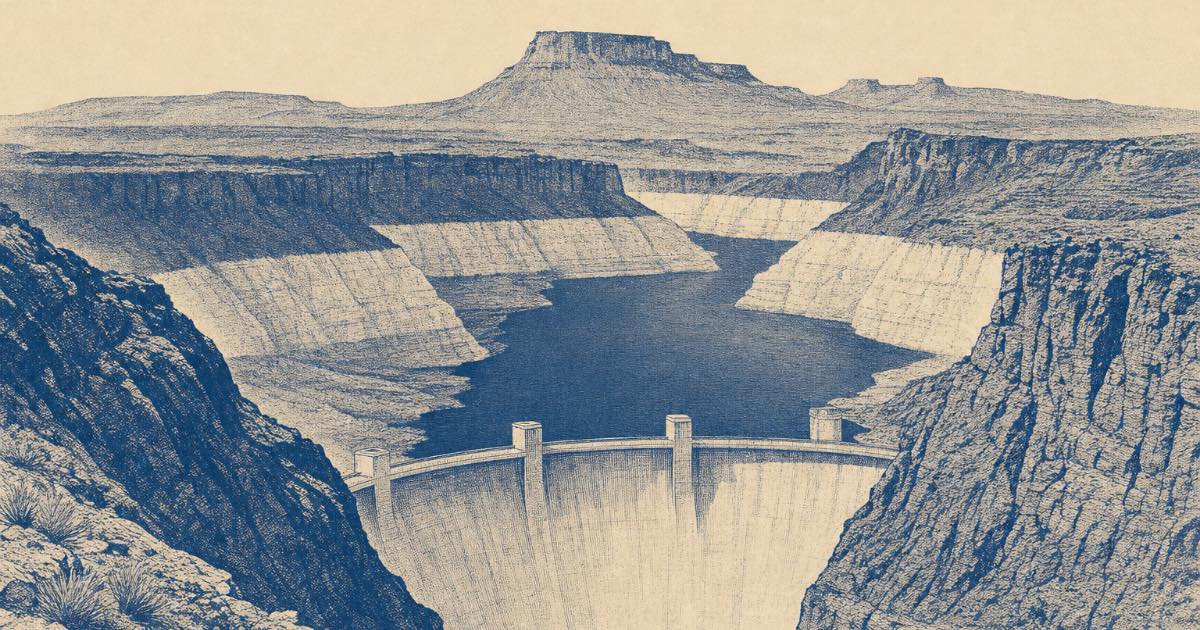
Illustration of a canyon reservoir at low water behind an arch dam, drawn in the style of a mid-century geological survey report.
Western reservoirs at low water - daily elevation, storage and percent full for 135 of them, straight from the government gauges that measure them. Illustration; not a photograph and not a specific reservoir.

Of the 135 reservoirs tracked here, 30 are below half of capacity right now, and 102 hold less water than they did a year ago (32 hold more). The Colorado River system as a whole is 32.1% full - low. The emptiest reservoir on this page is Palo Duro Reservoir at 0.4%; the fullest is Comanche Creek Reservoir at 100.0%.

Colorado River system32.1% fullLow18.67 of 58.15 MAF across 7 reservoirs▼ −2.89 MAF vs 1 yr agoas of · system page →

❄️ Snowpack watch: Upper Colorado snowpack holds 0.41" of snow-water-equivalent on Oct 30, early in water year 2027; last winter peaked at 55% of the median peak. See the snowpack tracker →

Effectively full 95% and aboveHigh 75–95%Moderate 50–75%Low 30–50%Very low 15–30%Critically low under 15%

These bands describe share of capacity, not drought severity - some reservoirs are held near the top of a narrow band by design. How they are defined.

Colorado River system

Seven reservoirs on the Colorado and its tributaries. Mead and Powell hold nearly all of the system's water; the rest are regulating or headwater units held closer to full.

26.3%
Very low
38% of the Oct 29 average
1,038.51 ft · 6,875,460 AF
wk +1.35 ft · yr -19.06 ft
25.4%
Very low
40% of the Oct 29 average
3,531.42 ft · 5,921,750 AF
wk +7.83 ft · yr -14.11 ft
86.8%
High
112% of the Oct 29 average
638.18 ft · 1,625,520 AF
wk -0.78 ft · yr +0.22 ft
92.7%
High
94% of the Oct 29 average
447.85 ft · 528,501 AF
wk -0.64 ft · yr +0.75 ft
64.7%
Moderate
79% of the Oct 29 average
6,004.83 ft · 2,425,190 AF
wk -0.55 ft · yr -17.62 ft
18.4%
Very low
27% of the Oct 29 average
7,415.54 ft · 152,336 AF
wk +3.48 ft · yr -49.15 ft
67.5%
Moderate
97% of the Oct 29 average
6,047.63 ft · 1,143,970 AF
wk +20.89 ft · yr +14.21 ft

California

Eight of California's largest reservoirs, from Trinity and Shasta in the north to San Luis in the Central Valley. These refill from winter rain and Sierra snowmelt, so they normally peak in spring and draw down through the summer.

50.1%
Moderate
97% of the Oct 29 average
972.89 ft · 2,279,839 AF
wk -2.42 ft · yr -14.21 ft
43.0%
Low
84% of the Oct 29 average
735.79 ft · 1,471,501 AF
wk -2.65 ft · yr -39.33 ft
38.4%
Low
91% of the Oct 29 average
399.30 ft · 374,789 AF
wk -1.66 ft · yr -6.98 ft
82.6%
High
118% of the Oct 29 average
427.49 ft · 1,323,076 AF
wk -0.23 ft · yr -1.51 ft
62.7%
Moderate
117% of the Oct 29 average
1,003.71 ft · 1,505,484 AF
wk -0.23 ft · yr -11.91 ft
66.9%
Moderate
113% of the Oct 29 average
2,314.25 ft · 1,637,098 AF
wk -0.64 ft · yr -7.76 ft
72.6%
Moderate
113% of the Oct 29 average
781.72 ft · 1,474,466 AF
wk -1.01 ft · yr -4.07 ft
67.4%
Moderate
154% of the Oct 29 average
488.25 ft · 1,374,943 AF
wk -3.62 ft · yr +28.45 ft

Texas & Rio Grande

Six reservoirs across central Texas and the Rio Grande. The Highland Lakes above Austin and Canyon Lake respond quickly to storms; Amistad, Falcon and Elephant Butte track the longer Rio Grande drought.

93.4%
High
122% of the Oct 30 average
677.13 ft · 1,026,079 AF
wk -0.24 ft · yr +7.71 ft
95.8%
Effectively full
123% of the Oct 30 average
1,018.35 ft · 829,938 AF
wk +0.00 ft · yr +0.18 ft
96.1%
Effectively full
106% of the Oct 30 average
907.19 ft · 364,062 AF
wk -0.21 ft · yr +16.94 ft
46.6%
Low
62% of the Oct 30 average
1,063.50 ft · 845,321 AF
wk +0.78 ft · yr +5.83 ft
20.8%
Very low
35% of the Oct 30 average
260.77 ft · 324,922 AF
wk -0.24 ft · yr +7.34 ft
6.1%
Critically low
19% of the Oct 30 average
4,301.22 ft · 121,787 AF
wk +4.50 ft · yr +7.00 ft
6.7%
Critically low
15% of the Oct 30 average
1,990.87 ft · 531 AF
wk -0.07 ft · yr +2.43 ft
72.9%
Moderate
86% of the Oct 30 average
2,209.38 ft · 70,180 AF
wk -0.16 ft · yr -6.87 ft
80.5%
High
98% of the Oct 30 average
917.27 ft · 15,507 AF
wk -0.06 ft · yr -1.62 ft
80.2%
High
85% of the Oct 30 average
534.52 ft · 34,662 AF
wk -0.15 ft · yr -1.71 ft
79.3%
High
106% of the Oct 30 average
545.56 ft · 31,839 AF
wk -0.33 ft · yr -2.65 ft
69.8%
Moderate
99% of the Oct 30 average
920.71 ft · 160,840 AF
wk -0.08 ft · yr -3.11 ft
96.4%
Effectively full
105% of the Oct 30 average
439.41 ft · 28,430 AF
wk -0.05 ft · yr -0.69 ft
96.3%
Effectively full
101% of the Oct 30 average
492.23 ft · 23,081 AF
wk +0.12 ft · yr +0.06 ft
96.5%
Effectively full
97% of the Oct 30 average
82.76 ft · 66,758 AF
wk -0.03 ft · yr +0.22 ft
84.5%
High
88% of the Oct 30 average
418.85 ft · 37,075 AF
wk -0.10 ft · yr -1.72 ft
96.2%
Effectively full
102% of the Oct 30 average
592.65 ft · 416,070 AF
wk -0.16 ft · yr -0.89 ft
74.6%
Moderate
92% of the Oct 30 average
687.51 ft · 63,922 AF
wk +0.05 ft · yr -3.62 ft
86.9%
High
93% of the Oct 30 average
334.58 ft · 167,295 AF
wk -0.09 ft · yr -1.68 ft
86.8%
High
531.00 ft · 319,018 AF
wk -0.17 ft · yr -1.12 ft
74.3%
Moderate
88% of the Oct 30 average
562.13 ft · 8,198 AF
wk -0.09 ft · yr -0.17 ft
83.6%
High
154% of the Oct 30 average
1,740.50 ft · 24,097 AF
wk -0.02 ft · yr -0.79 ft
72.0%
Moderate
96% of the Oct 30 average
826.72 ft · 267,906 AF
wk -0.04 ft · yr -5.45 ft
88.8%
High
112% of the Oct 30 average
1,422.66 ft · 116,148 AF
wk -0.08 ft · yr +0.43 ft
44.0%
Low
49% of the Oct 30 average
167.21 ft · 13,165 AF
wk -0.09 ft · yr -1.41 ft
71.8%
Moderate
82% of the Oct 30 average
315.89 ft · 462,730 AF
wk -0.19 ft · yr -3.44 ft
45.1%
Low
157% of the Oct 30 average
2,063.79 ft · 18,772 AF
wk +0.00 ft · yr +1.06 ft
75.6%
High
85% of the Oct 30 average
276.92 ft · 30,299 AF
wk -0.13 ft · yr -2.87 ft
21.0%
Very low
38% of the Oct 30 average
190.45 ft · 139,454 AF
wk -0.14 ft · yr +8.15 ft
42.2%
Low
73% of the Oct 30 average
1,502.89 ft · 12,252 AF
wk -0.06 ft · yr -3.63 ft
77.3%
High
104% of the Oct 30 average
1,712.50 ft · 29,447 AF
wk -0.05 ft · yr -2.35 ft
75.0%
Moderate
87% of the Oct 30 average
94.68 ft · 23,265 AF
wk +0.03 ft · yr -0.76 ft
52.8%
Moderate
96% of the Oct 30 average
2,058.71 ft · 16,246 AF
wk +0.02 ft · yr -1.46 ft
100.0%
Effectively full
100% of the Oct 30 average
775.41 ft · 151,250 AF
wk +0.04 ft · yr +0.36 ft
92.4%
High
99% of the Oct 30 average
199.37 ft · 385,868 AF
wk -0.11 ft · yr -0.70 ft
79.5%
High
112% of the Oct 30 average
91.23 ft · 203,630 AF
wk -0.09 ft · yr +14.31 ft
81.9%
High
95% of the Oct 30 average
474.37 ft · 7,528 AF
wk -0.06 ft · yr -0.60 ft
87.8%
High
94% of the Oct 30 average
375.40 ft · 58,589 AF
wk -0.08 ft · yr -1.71 ft
9.3%
Critically low
71% of the Oct 30 average
1,842.14 ft · 48,339 AF
wk +0.05 ft · yr -5.44 ft
72.0%
Moderate
87% of the Oct 30 average
642.89 ft · 133,238 AF
wk -0.16 ft · yr -3.56 ft
79.3%
High
86% of the Oct 30 average
397.94 ft · 480,841 AF
wk -0.13 ft · yr -2.92 ft
66.5%
Moderate
95% of the Oct 30 average
1,629.02 ft · 46,596 AF
wk -0.08 ft · yr -1.85 ft
78.3%
High
110% of the Oct 30 average
784.21 ft · 29,746 AF
wk -0.14 ft · yr +1.75 ft
85.4%
High
102% of the Oct 30 average
245.45 ft · 21,970 AF
wk -0.05 ft · yr -1.57 ft
65.8%
Moderate
81% of the Oct 30 average
1,068.01 ft · 29,813 AF
wk -0.13 ft · yr -3.71 ft
88.1%
High
92% of the Oct 30 average
690.67 ft · 117,111 AF
wk +0.00 ft · yr -1.20 ft
98.9%
Effectively full
101% of the Oct 30 average
503.86 ft · 51,250 AF
wk -0.02 ft · yr +0.24 ft
90.4%
High
102% of the Oct 30 average
532.53 ft · 147,442 AF
wk -0.14 ft · yr -2.27 ft
4.3%
Critically low
18% of the Oct 30 average
2,606.56 ft · 2,600 AF
wk -0.09 ft · yr -6.87 ft
74.8%
Moderate
104% of the Oct 30 average
365.21 ft · 4,511 AF
wk -0.08 ft · yr -0.87 ft
44.5%
Low
91% of the Oct 30 average
1,888.07 ft · 3,611 AF
wk -0.05 ft · yr -3.85 ft
98.4%
Effectively full
102% of the Oct 30 average
42.20 ft · 130,266 AF
wk +0.05 ft · yr +0.03 ft
93.3%
High
98% of the Oct 30 average
259.10 ft · 15,968 AF
wk -0.03 ft · yr -0.95 ft
35.6%
Low
59% of the Oct 30 average
1,165.92 ft · 111,476 AF
wk -0.09 ft · yr -3.85 ft
97.9%
Effectively full
106% of the Oct 30 average
714.53 ft · 23,553 AF
wk -0.07 ft · yr +1.52 ft
95.6%
Effectively full
101% of the Oct 30 average
887.25 ft · 13,131 AF
wk -0.11 ft · yr +8.00 ft
20.4%
Very low
86% of the Oct 30 average
2,226.32 ft · 40,773 AF
wk -0.05 ft · yr -7.13 ft
95.2%
Effectively full
96% of the Oct 30 average
420.92 ft · 24,435 AF
wk -0.08 ft · yr -1.18 ft
63.5%
Moderate
86% of the Oct 30 average
434.20 ft · 164,294 AF
wk -0.23 ft · yr -2.70 ft
90.8%
High
85% of the Oct 30 average
519.86 ft · 135,930 AF
wk -0.12 ft · yr -0.85 ft
74.3%
Moderate
98% of the Oct 30 average
1,139.70 ft · 182,217 AF
wk +0.13 ft · yr -4.38 ft
80.0%
High
117% of the Oct 30 average
1,041.86 ft · 69,053 AF
wk -0.07 ft · yr -1.39 ft
89.6%
High
91% of the Oct 30 average
227.04 ft · 216,345 AF
wk -0.10 ft · yr -1.49 ft
78.3%
High
102% of the Oct 30 average
487.49 ft · 320,948 AF
wk -0.13 ft · yr -1.71 ft
74.6%
Moderate
99% of the Oct 30 average
1,370.53 ft · 20,708 AF
wk -0.08 ft · yr -1.67 ft
81.1%
High
97% of the Oct 30 average
517.86 ft · 456,933 AF
wk -0.19 ft · yr -3.34 ft
81.8%
High
93% of the Oct 30 average
359.85 ft · 166,599 AF
wk -0.14 ft · yr -1.42 ft
91.0%
High
89% of the Oct 30 average
129.07 ft · 1,458,915 AF
wk -0.19 ft · yr -0.97 ft
87.3%
High
97% of the Oct 30 average
1,005.33 ft · 10,427 AF
wk -0.10 ft · yr -3.05 ft
98.5%
Effectively full
103% of the Oct 30 average
824.74 ft · 111,109 AF
wk -0.07 ft · yr +0.07 ft
10.8%
Critically low
86% of the Oct 30 average
3,018.33 ft · 5,015 AF
wk +0.02 ft · yr -4.38 ft
98.3%
Effectively full
106% of the Oct 30 average
736.79 ft · 7,469 AF
wk +0.18 ft · yr +0.48 ft
74.7%
Moderate
93% of the Oct 30 average
301.81 ft · 56,566 AF
wk -0.15 ft · yr -2.71 ft
27.1%
Very low
50% of the Oct 30 average
1,018.99 ft · 69,074 AF
wk -0.76 ft · yr +37.33 ft
45.4%
Low
139% of the Oct 30 average
2,891.81 ft · 226,854 AF
wk +0.40 ft · yr -1.26 ft
62.4%
Moderate
101% of the Oct 30 average
1,328.50 ft · 16,708 AF
wk -0.08 ft · yr -2.30 ft
84.3%
High
86% of the Oct 30 average
861.15 ft · 4,446 AF
wk -0.06 ft · yr -0.38 ft
71.4%
Moderate
78% of the Oct 30 average
334.42 ft · 24,791 AF
wk -0.08 ft · yr -1.63 ft
100.0%
Effectively full
105% of the Oct 30 average
457.72 ft · 22,850 AF
wk +0.02 ft · yr -0.09 ft
86.1%
High
97% of the Oct 30 average
263.71 ft · 32,976 AF
wk -0.08 ft · yr -0.89 ft
82.1%
High
94% of the Oct 30 average
275.51 ft · 32,437 AF
wk -0.15 ft · yr -1.88 ft
86.3%
High
103% of the Oct 30 average
1,871.78 ft · 8,294 AF
wk +0.02 ft · yr +0.11 ft
78.7%
High
91% of the Oct 30 average
422.14 ft · 39,230 AF
wk -0.09 ft · yr -1.81 ft
23.6%
Very low
34% of the Oct 30 average
493.26 ft · 2,026 AF
wk -0.06 ft · yr -0.42 ft
72.9%
Moderate
91% of the Oct 30 average
822.86 ft · 15,625 AF
wk -0.08 ft · yr -3.07 ft
75.3%
High
196% of the Oct 30 average
1,045.53 ft · 11,590 AF
wk -0.07 ft · yr -1.37 ft
10.4%
Critically low
165% of the Oct 30 average
1,871.85 ft · 12,073 AF
wk -0.02 ft · yr -
40.8%
Low
95% of the Oct 30 average
1,528.97 ft · 225,953 AF
wk -0.12 ft · yr -3.64 ft
13.6%
Critically low
32% of the Oct 30 average
1,973.36 ft · 5,323 AF
wk +0.09 ft · yr -4.81 ft
86.6%
High
95% of the Oct 30 average
342.78 ft · 318,199 AF
wk -0.10 ft · yr -1.90 ft
0.4%
Critically low
6% of the Oct 30 average
2,826.20 ft · 223 AF
wk -0.01 ft · yr -1.59 ft
73.0%
Moderate
105% of the Oct 30 average
863.56 ft · 19,548 AF
wk -0.11 ft · yr -1.06 ft
86.9%
High
105% of the Oct 30 average
731.27 ft · 22,592 AF
wk -0.12 ft · yr -0.92 ft
88.3%
High
93% of the Oct 30 average
448.57 ft · 100,375 AF
wk -0.15 ft · yr -0.59 ft
91.9%
High
98% of the Oct 30 average
996.50 ft · 494,789 AF
wk +0.10 ft · yr -0.47 ft
56.3%
Moderate
77% of the Oct 30 average
1,155.92 ft · 30,857 AF
wk -0.09 ft · yr -3.66 ft
83.1%
High
95% of the Oct 30 average
431.77 ft · 365,171 AF
wk -0.15 ft · yr -2.10 ft
93.5%
High
105% of the Oct 30 average
630.65 ft · 736,775 AF
wk -0.10 ft · yr -1.03 ft
45.5%
Low
95% of the Oct 30 average
2,814.68 ft · 66,079 AF
wk -0.21 ft · yr -1.61 ft
89.3%
High
97% of the Oct 30 average
312.25 ft · 981,786 AF
wk -0.11 ft · yr -1.11 ft
60.9%
Moderate
75% of the Oct 30 average
152.88 ft · 1,739,081 AF
wk -0.27 ft · yr -2.98 ft
86.2%
High
97% of the Oct 30 average
236.09 ft · 129,611 AF
wk -0.21 ft · yr +0.29 ft
73.5%
Moderate
106% of the Oct 30 average
1,414.06 ft · 37,891 AF
wk -0.06 ft · yr -1.81 ft
96.2%
Effectively full
103% of the Oct 30 average
620.63 ft · 221,122 AF
wk -0.19 ft · yr -1.03 ft
71.9%
Moderate
78% of the Oct 30 average
290.47 ft · 12,135 AF
wk -0.06 ft · yr -2.79 ft
83.0%
High
98% of the Oct 30 average
457.22 ft · 14,732 AF
wk -0.07 ft · yr +0.44 ft
16.3%
Very low
39% of the Oct 30 average
2,090.24 ft · 1,998 AF
wk -0.02 ft · yr -5.48 ft
88.9%
High
100% of the Oct 30 average
434.78 ft · 774,619 AF
wk -0.17 ft · yr -1.30 ft
82.6%
High
96% of the Oct 30 average
41.15 ft · 131,375 AF
wk -0.65 ft · yr +1.52 ft
100.0%
Effectively full
104% of the Oct 30 average
617.05 ft · 1,243,801 AF
wk +0.59 ft · yr +0.50 ft
84.3%
High
104% of the Oct 30 average
167.72 ft · 1,885,172 AF
wk -0.12 ft · yr -0.07 ft
4.2%
Critically low
25% of the Oct 30 average
1,894.11 ft · 7,689 AF
wk -0.23 ft · yr -11.32 ft
82.3%
High
95% of the Oct 30 average
372.49 ft · 59,293 AF
wk -0.13 ft · yr -1.56 ft
86.6%
High
100% of the Oct 30 average
459.12 ft · 163,593 AF
wk -0.16 ft · yr -2.66 ft
74.4%
Moderate
89% of the Oct 30 average
526.85 ft · 8,233 AF
wk -0.06 ft · yr -1.91 ft
58.6%
Moderate
77% of the Oct 30 average
888.41 ft · 10,444 AF
wk -0.15 ft · yr -2.18 ft
27.4%
Very low
113% of the Oct 30 average
2,351.83 ft · 8,711 AF
wk -0.03 ft · yr -2.15 ft
90.1%
High
109% of the Oct 30 average
530.48 ft · 509,173 AF
wk -0.20 ft · yr -1.21 ft
68.6%
Moderate
82% of the Oct 30 average
591.67 ft · 16,759 AF
wk +0.10 ft · yr -1.05 ft
100.0%
Effectively full
92% of the Oct 30 average
224.78 ft · 122,593 AF
wk -0.12 ft · yr +0.10 ft

Biggest changes over the past year

Change in storage over the trailing twelve months, measured in percentage points of each reservoir's own capacity so the figures are comparable.

Lost the most

  1. Caddo Lake -56.0 points of capacity, to 44.0% full
  2. Blue Mesa Reservoir -29.5 points of capacity, to 18.4% full
  3. Lake Striker -28.1 points of capacity, to 71.9% full
  4. Lake Kemp -25.7 points of capacity, to 74.3% full
  5. Proctor Lake -24.1 points of capacity, to 56.3% full

Gained the most

  1. Lake Corpus Christi +66.6 points of capacity, to 79.5% full
  2. Inks Lake +38.2 points of capacity, to 95.6% full
  3. Canyon Lake +31.6 points of capacity, to 96.1% full
  4. Medina Lake +21.7 points of capacity, to 27.1% full
  5. San Luis Reservoir +14.9 points of capacity, to 67.4% full

Context pages

Colorado River system storage - combined storage across all seven tracked reservoirs, with a downloadable daily system-total CSV.
Colorado River shortage tiers - the 1,075 / 1,050 / 1,025 ft Lake Mead thresholds from the 2007 Interim Guidelines and DCP, and what applies in 2026.
Post-2026 operating guidelines - the process replacing the current rules, which expire at the end of 2026.
Data downloads - full-history daily CSVs for all 135 reservoirs.

Changes shown are elevation changes in feet over the trailing week and year. Percent full is storage divided by each reservoir's published capacity - bases and sources on the about page. This site publishes observations only: no forecasts of its own, no advice.

Get the reservoir data in your inbox

For reporters and researchers: an occasional heads-up when Western reservoirs hit a notable milestone - a new record low, a shortage-tier change, or the yearly Colorado River operating decision - with the government data behind it. No spam.

Free · double opt-in · unsubscribe anytime · we store only your email.